Summary
- 1.January 2025 – Surface air temperature and sea surface temperature highlights
- 2.January 2025 – Sea Ice highlights
- 3.Information about the C3S data set and how it is compiled
- 4.Information on national records and impacts
- 5.About Copernicus
Bonn, 06/02/2025
January 2025 – Surface air temperature and sea surface temperature highlights
Global Temperatures
- January 2025 was the warmest January globally, with an average ERA5 surface air temperature of 13.23°C, 0.79°C above the 1991-2020 average for January.
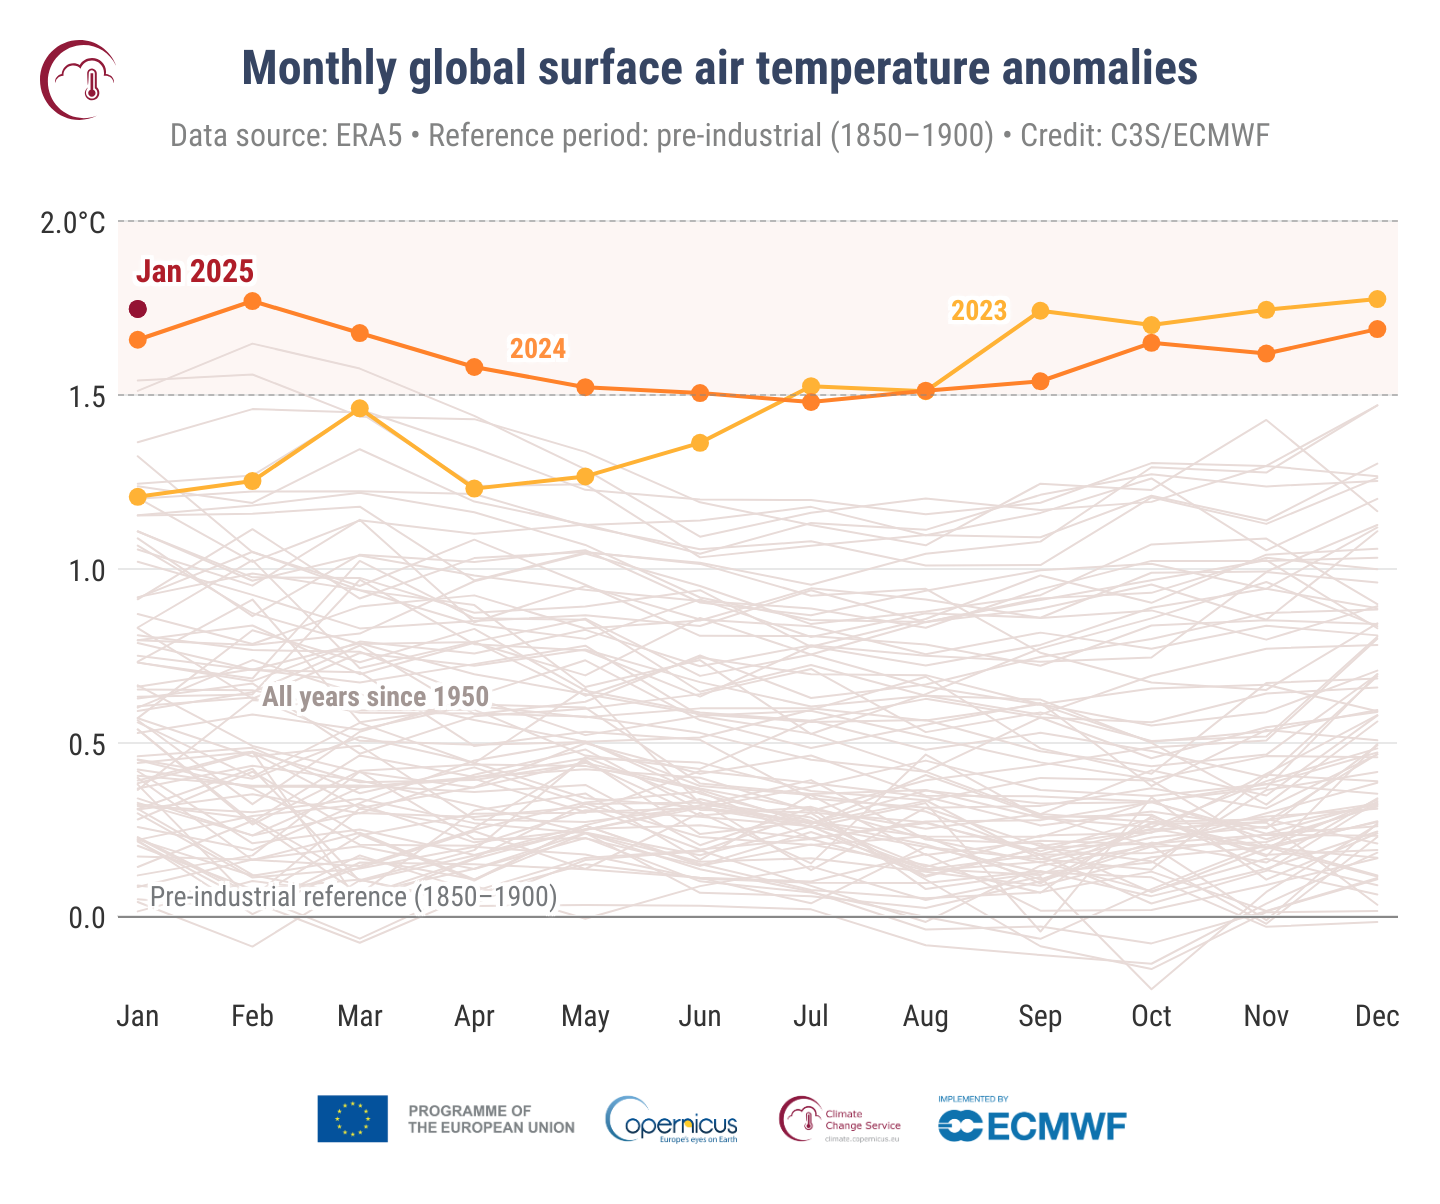
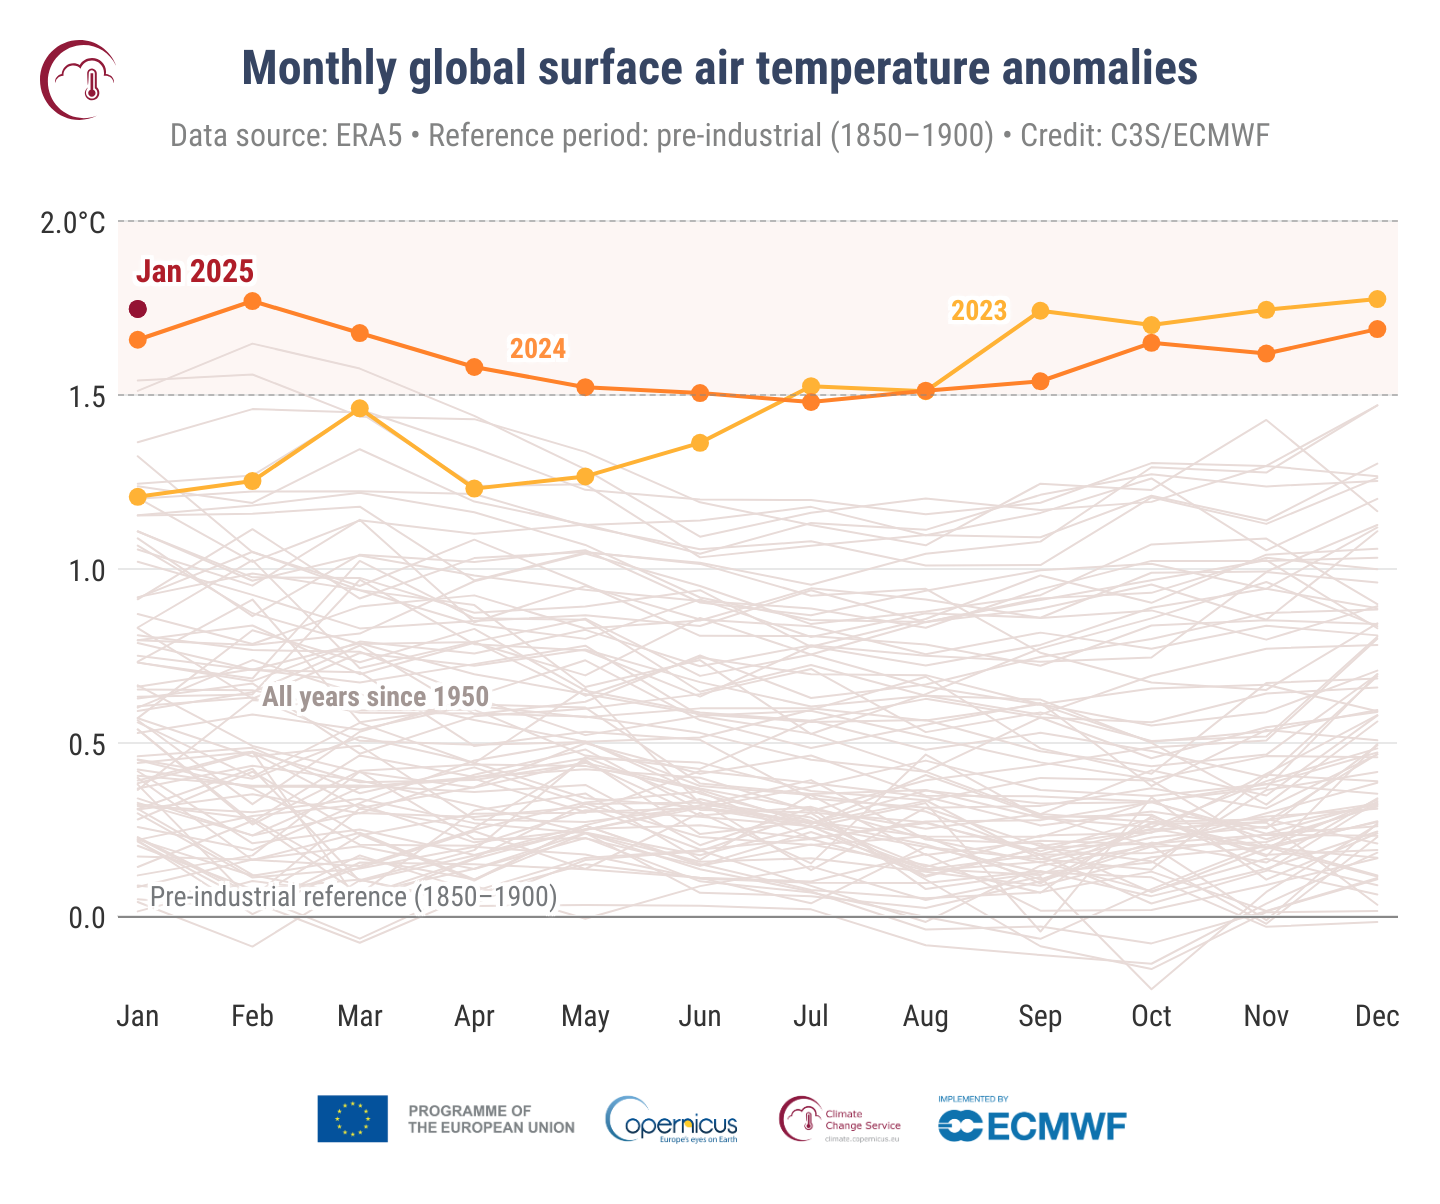
- January 2025 was 1.75°C above the pre-industrial level and was the 18th month in the last nineteen months for which the global-average surface air temperature was more than 1.5°C above the pre-industrial level.
- The last 12-monthsperiod (February 2024 – January 2025) was 0.73°C above the 1991-2020 average, and 1.61°C above the estimated 1850-1900 average used to define the pre-industrial level.
*Datasets other than ERA5 may not confirm the 18 months above 1.5°C highlighted here, due to the relatively small margins above 1.5°C of ERA5 global temperatures observed for several months and differences among the various datasets.
Europe and other regions
- The average temperature over European land for January 2025 was 1.80°C, 2.51°C above the 1991-2020 average for January, the second warmest after January 2020, which was 2.64°C above average.
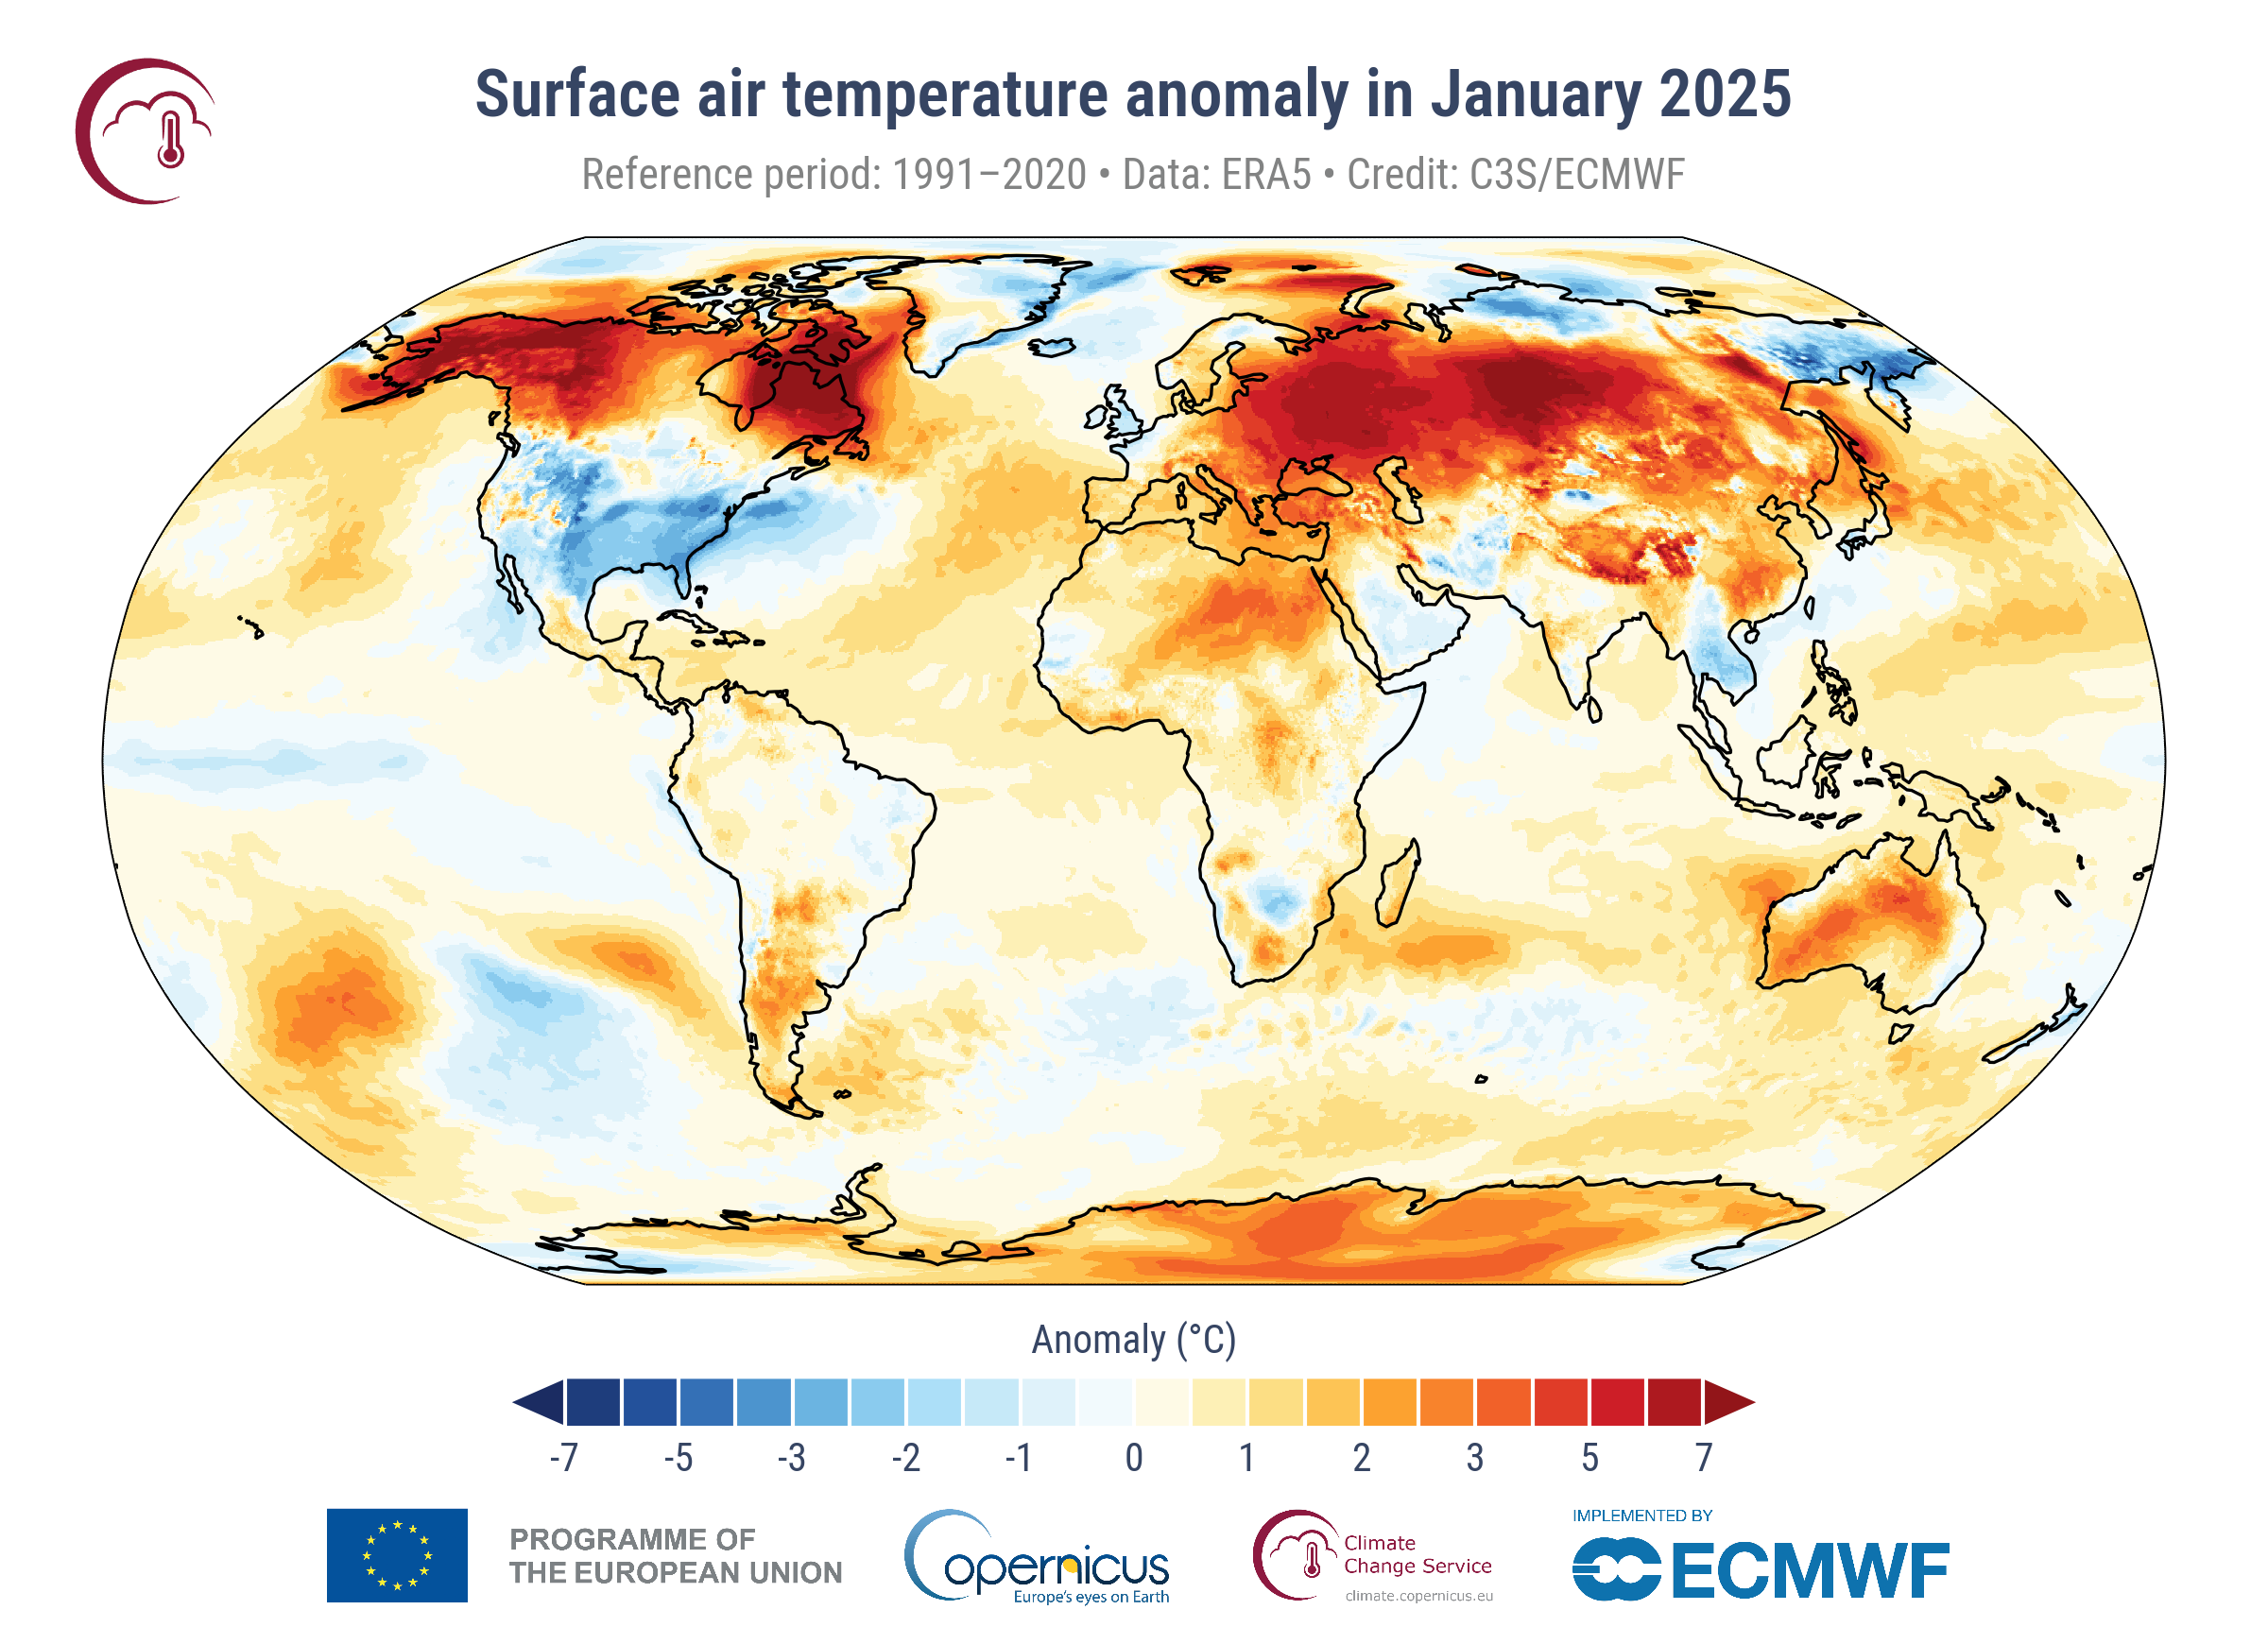
- European temperatures were most above the 1991-2020 average over southern and eastern Europe, including western Russia. In contrast, they were below average over Iceland, the United Kingdom and Ireland, northern France, and northern Fennoscandia.
- Outside Europe, temperatures were most above average over northeast and northwest Canada, Alaska, and Siberia. They were also above average over southern South America, Africa, and much of Australia and Antarctica.
- Temperatures were most notably below average over the United States and the easternmost regions of Russia, Chukotka and Kamchatka. The Arabian Peninsula and mainland Southeast Asia also had below-average temperatures.
Sea surface temperature
- The average sea surface temperature (SST) for January 2025 over 60°S–60°N was 20.78°C, the second-highest value on record for the month, 0.19°C below the January 2024 record.
- SSTs were below average over the central equatorial Pacific, but close to or above average over the eastern equatorial Pacific, suggesting a slowing or stalling of the move towards La Niña conditions. SSTs remained unusually high in many other ocean basins and seas.
According to Samantha Burgess, Strategic Lead for Climate at ECMWF:
“January 2025 is another surprising month, continuing the record temperatures observed throughout the last two years, despite the development of La Niña conditions in the tropical Pacific and their temporary cooling effect on global temperatures. Copernicus will continue to closely monitor ocean temperatures and their influence on our evolving climate throughout 2025.”
January 2025 – Hydrological highlights
- January 2025 saw predominantly wetter-than-average conditions over regions of western Europe, as well as parts of Italy, Scandinavia and the Baltic countries; heavy precipitation led to flooding in some regions.
- Conversely, drier than average conditions established in northern UK and Ireland, eastern Spain, and north of the Black Sea.
- Beyond Europe, it was wetter than average in Alaska, Canada, central and eastern Russia, eastern Australia, south-eastern Africa, southern Brazil, with regions experiencing floods and associated damage.
- Drier than average conditions established in southwestern United States and northern Mexico, northern Africa, the Middle East, across Central Asia and in eastern China as well as in much of southern Africa, southern South America and Australia.
January 2025 – Sea Ice highlights
- Arctic sea ice reached its lowest monthly extent for January, at 6% below average, virtually tied with January 2018.
- In the Arctic region, sea ice concentration anomalies were well below average in the eastern Canadian sector, including Hudson Bay and the Labrador Sea, and in the northern Barents Sea.
- Antarctic sea ice extent was 5% below average and thus relatively close to average compared to other recent years. This contrasts with the record or near-record values observed in 2023–2024.
- In the Antarctic region, sea ice concentrations were above average in the Amundsen Sea and generally mixed in other ocean sectors.
More information about climate variables in January and climate updates of previous months as well as high-resolution graphics can be downloadedhere.
Other useful links:
Answers to frequently asked questions regarding temperature monitoring can be foundhere.
Follow near-real-time data for the globe on Climate Pulsehere.
More on trends and projections on Climate Atlashere.
Information about the C3S data set and how it is compiled
Temperature and hydrological maps and data are from ECMWF Copernicus Climate Change Service’s ERA5 and ERA5-Land (surface soil moisture) datasets. The findings about global sea surface temperatures (SSTs) presented here are based on SST data from ERA5 averaged over the 60°S–60°N domain. Note that ERA5 SSTs are estimates of the ocean temperature at about 10m depth (known as foundation temperature). The results may differ from other SST products providing temperature estimates at different depths, such as 20cm depth for NOAA’s OISST. Sea ice maps and data are from a combination of information from ERA5, as well as from the EUMETSAT OSI SAF Sea Ice Index v2.2. Regional area averages quoted here are the following longitude/latitude bounds: Globe, 180W-180E, 90S-90N, over land and ocean surfaces. Europe, 25W-40E, 34N-72N, over land surfaces only.
More information about the data can be foundhere.
Information on national records and impacts
Information on national records and impacts is based on national and regional reports. For details see the respective temperature and hydrologicalC3S climate bulletinfor the month. C3S has followed the recommendation of the World Meteorological Organization (WMO) to use the most recent 30-year period for calculating climatological averages and changed to the reference period of 1991-2020 for its C3S Climate Bulletins covering January 2021 onward. Figures and graphics for both the new and previous period (1981-2010) are provided for transparency.
More information on the reference period used can be foundhere.
About Copernicus