Bonn, 10/12/2024
Ozone hole 2024
Development of the daily extent of the Antarctic Ozone Hole Between 1 July and 8 December for 1979-2024 Source: CAMS/ECMWF.(Source: CAMS/ECMWF).DOWNLOAD HD ANIMATION
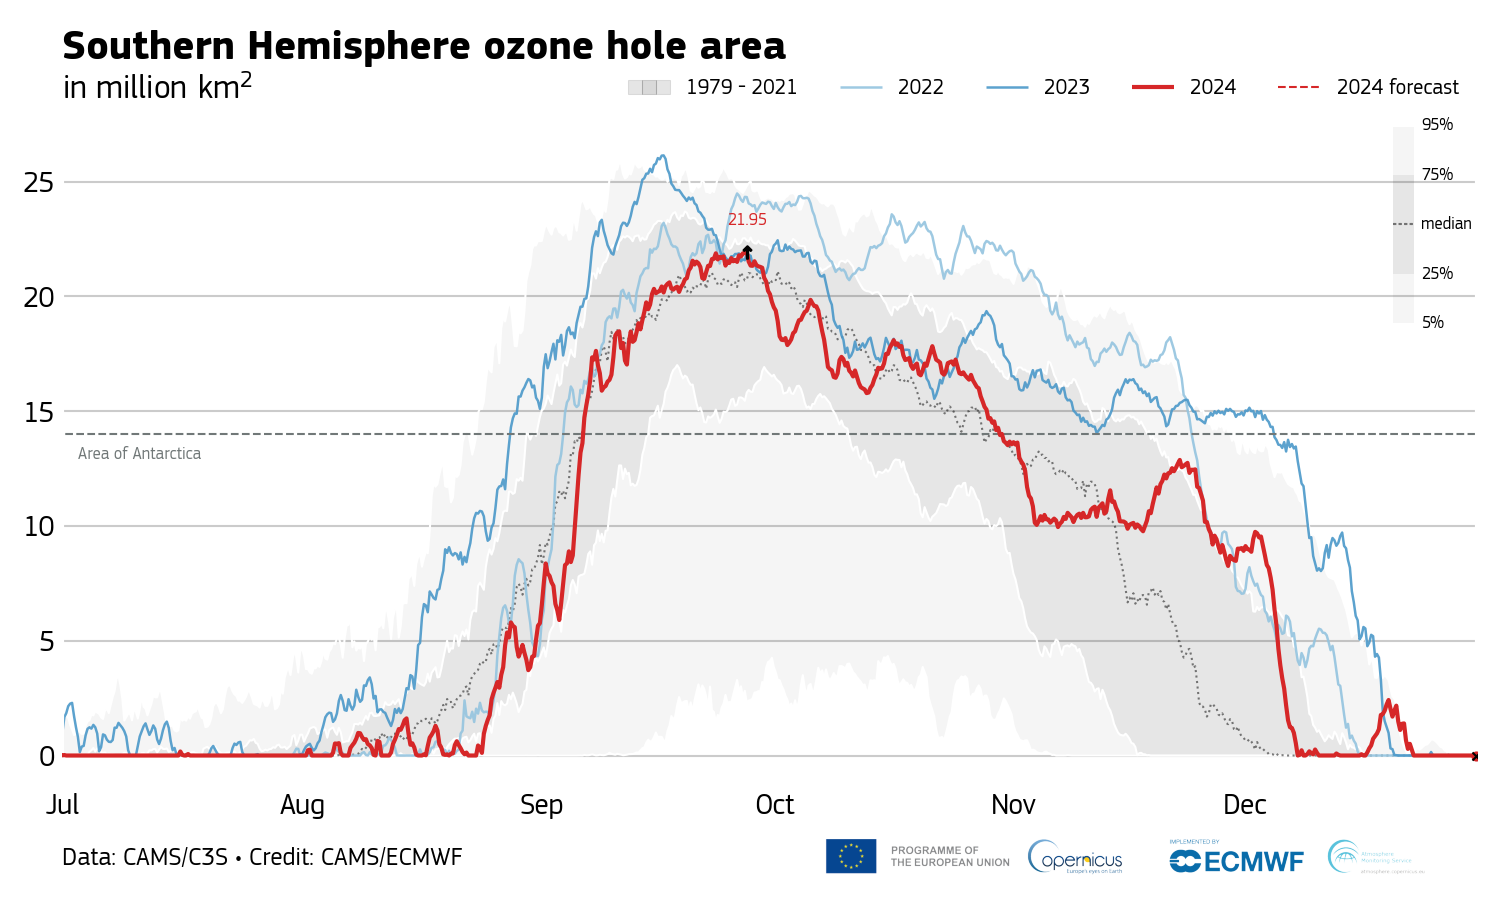
For the past four years, the annual Antarctic ozone hole has persisted for longer than usual and closing during the second half of December. Near real-time tracking from theCopernicus Atmosphere Monitoring Service (CAMS)shows that the 2024 Antarctic ozone hole broke the streak by following a more typical development. The ozone hole started to close in early December, which is closer to the average than in more recentyears. The other indicators normally used to track the ozone hole, such as total area, were also closer to the average than in the last few years.
The development of the Antarctic ozone hole in 2024 started later than average, mainly due to the disruption of the polar vortex following two sudden stratospheric warming episodes in July. As the polar vortex became established through August, the chemical depletion of stratospheric ozone over Antarctica was able to take effect, as it does every year. The area of the ozone hole kept increasing throughout September, closely following the 1979-2021 average, reaching its maximum size of 22 million km2by the end of the month. Not only is this smaller than the area in 2023 and 2022, when the maximum area was around 25 million km2, but the maximum occurred later than in 2023 and is in line with the historical average. While some of the recent year’s ozone holes were notable for closing later in the year on average, the 2024 closure has been more typical. The ozone hole area steadily decreased in size throughout October, in line with the average, but stabilised through November with an approximate area of 10 million km2per day during the month. The polar vortex broke down in the first week of December, quickly bringing the 2024 ozone hole closure in line with the 1979-2021 average closure date.
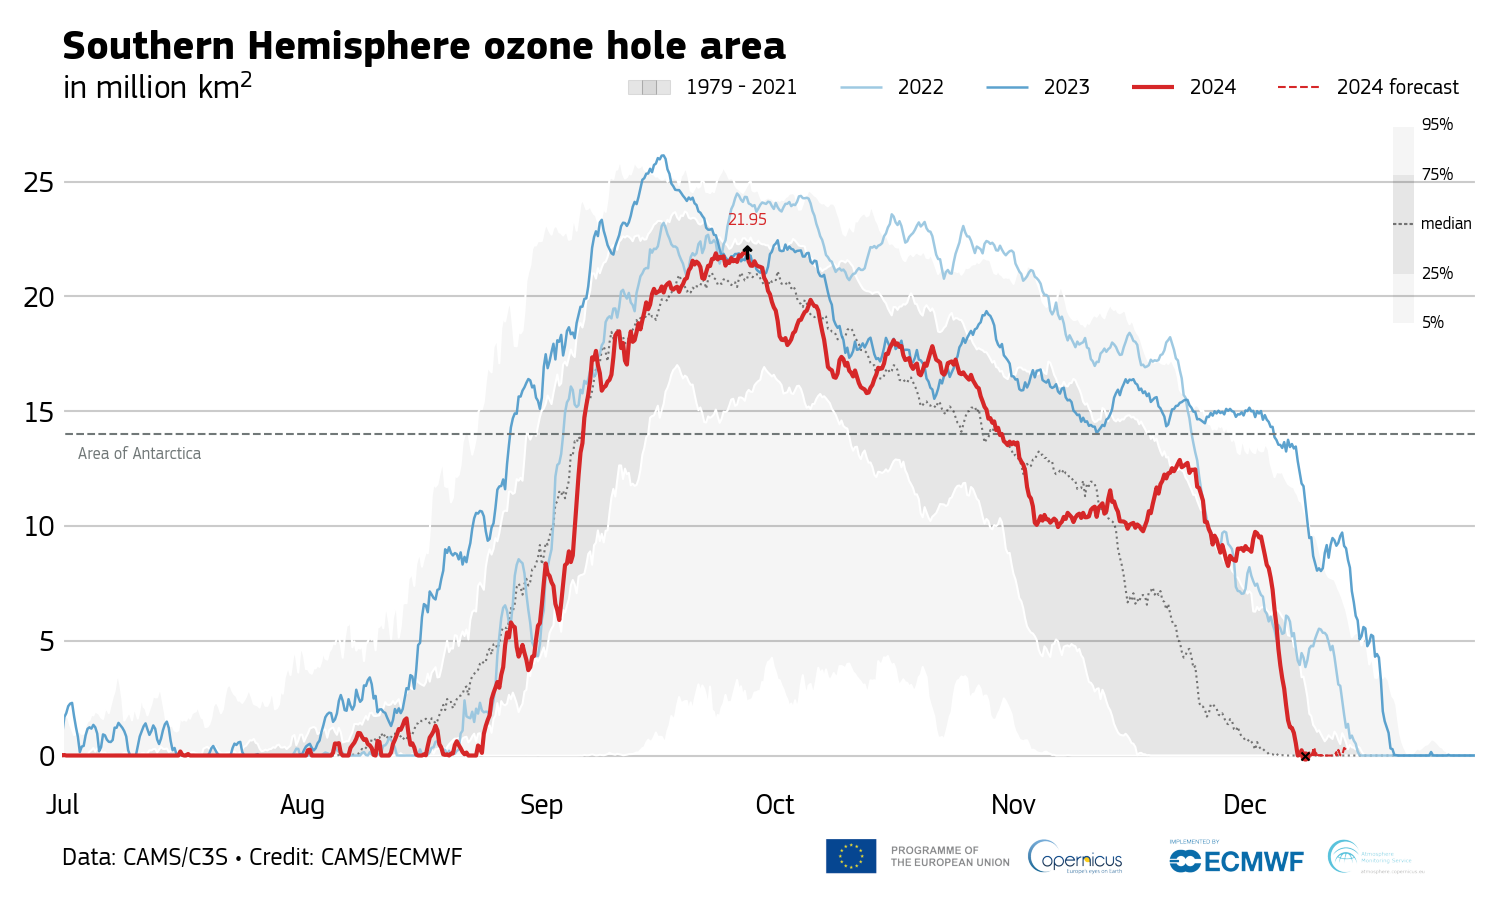
Time series of daily ozone hole area between 1 July and 8 December. The red line shows the data for 2024 and the dotted line the forecast for the following 5 days. The thicker, darker blue line is the evolution of the ozone hole during 2023, and the lighter blue line represents 2022. The grey colours represent the percentile values and the median between 1979 – 2021. (Credit: CAMS/ECMWF).DOWNLOAD IMAGE|DOWNLOAD DATA
Laurence Rouil, Director of the Copernicus Atmosphere Monitoring Service (CAMS) at ECMWF, says: “The Montreal Protocol and its subsequent amendments have been highly effective in curbing emissions of ozone-depleting substances, but there is still some variability in this process due to the natural variation of the other atmospheric variables at play. Hopefully, we will see the first signs of recovery of the ozone hole in the coming decades.”
Throughout the season, CAMS publishes up-to-date graphs with analysis, forecasts, and animations of the ozone hole onits monitoring page, which is regularly updated with the most recent information on the subject.